Questenaتدريب يوضح لك ما ينبغي مراجعته لاحقًا
السؤال 22

According to the chart, how many units did the factory produce in Q2?
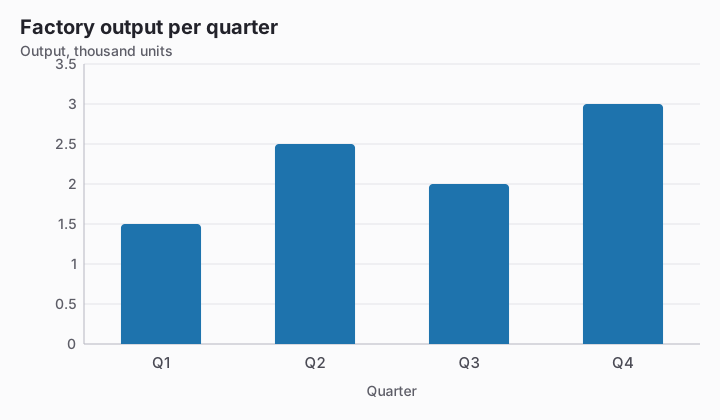
Bar chart titled Factory output per quarter. Value axis: Output, thousand units, gridlines every 0.5 from 0 to 3.5. Data: Q1 1.5, Q2 2.5, Q3 2, Q4 3.
  1. 250 units
  2. 2,500 unitsالإجابة الصحيحة
  3. 25 units
  4. 2.5 units

الشرح

Q2 is shown at 2.5 on an axis measured in thousand units, so the production count is 2.5 times 1,000, or 2,500 units. A reading of 250 uses a factor of 100 and therefore understates the scale by ten.

تابع هذا الاختبار

بدء التدريب
السؤال 22: According to the chart, how many units did the factory… · Reading Charts and Tables · Questena