QuestenaÜben und erkennen, was als Nächstes dran ist
Frage 1

According to the chart, in which month did the shop sell the most bicycles?
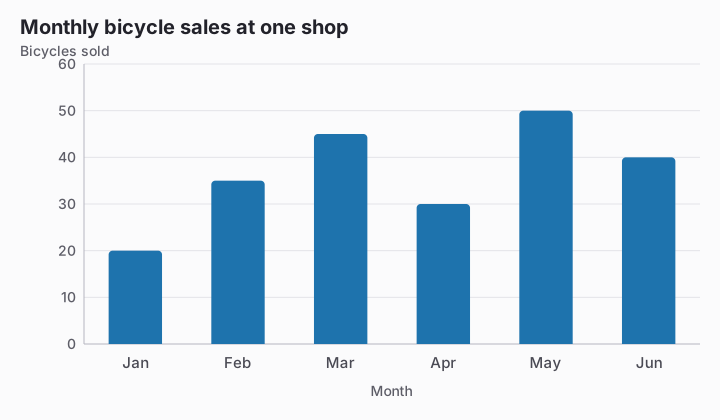
Bar chart titled Monthly bicycle sales at one shop. Value axis: Bicycles sold, gridlines every 10 from 0 to 60. Data: Jan 20, Feb 35, Mar 45, Apr 30, May 50, Jun 40.
  1. March
  2. June
  3. MayRichtige Antwort
  4. February

Erklärung

May reaches 50 bicycles, which is the largest plotted value among the six months. March is the closest alternative at 45, so its bar is high but does not reach the maximum.

Mit diesem Test weitermachen

Übung starten
Frage 1: According to the chart, in which month did the shop sell… · Reading Charts and Tables · Questena