QuestenaÜben und erkennen, was als Nächstes dran ist
Frage 12

According to the chart, which statements about commute times are supported? Select all that apply.
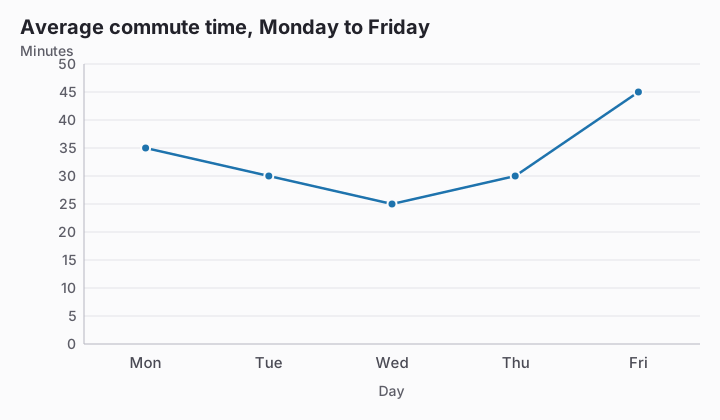
Line chart titled Average commute time, Monday to Friday. Value axis: Minutes, gridlines every 5 from 0 to 50. Data: Mon 35, Tue 30, Wed 25, Thu 30, Fri 45.
  1. Friday has the longest commute.Richtige Antwort
  2. Commute time falls steadily all week.
  3. Wednesday has the shortest commute.Richtige Antwort
  4. Tuesday and Thursday are equal.Richtige Antwort

Erklärung

Friday is longest at 45 minutes, Wednesday is shortest at 25, and Tuesday and Thursday both show 30, so all three comparisons hold. The claim of a steady fall fails because the line rises after Wednesday and ends above every earlier day.

Mit diesem Test weitermachen

Übung starten
Frage 12: According to the chart, which statements about commute… · Reading Charts and Tables · Questena