QuestenaÜben und erkennen, was als Nächstes dran ist
Frage 14

According to the chart, how many tickets were sold in March?
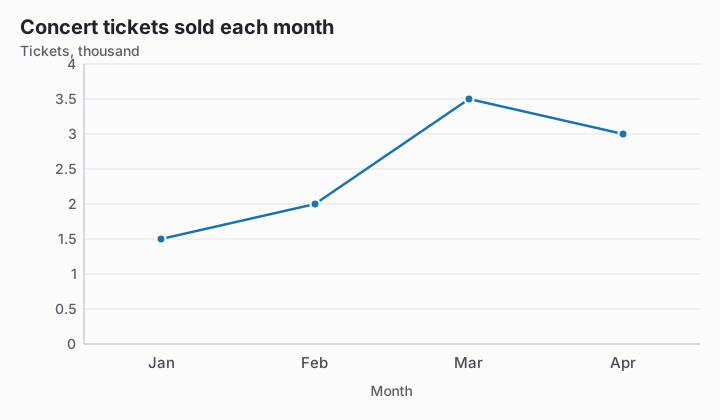
Line chart titled Concert tickets sold each month. Value axis: Tickets, thousand, gridlines every 0.5 from 0 to 4. Data: Jan 1.5, Feb 2, Mar 3.5, Apr 3.
  1. 3.5 tickets
  2. 350 tickets
  3. 3,500 ticketsRichtige Antwort
  4. 35 tickets

Erklärung

March is plotted at 3.5 on an axis measured in thousands, so multiplying by 1,000 gives 3,500 tickets. Reading the label as 3.5 individual tickets ignores the scale unit, while 350 applies the wrong conversion factor.

Mit diesem Test weitermachen

Übung starten
Frage 14: According to the chart, how many tickets were sold in March? · Reading Charts and Tables · Questena