QuestenaÜben und erkennen, was als Nächstes dran ist
Frage 25

According to the chart, which conclusion is supported by the displayed sales data?
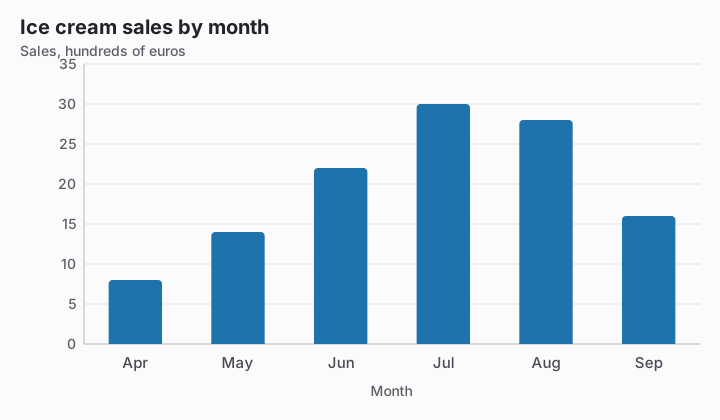
Bar chart titled Ice cream sales by month. Value axis: Sales, hundreds of euros, gridlines every 5 from 0 to 35. Data: Apr 8, May 14, Jun 22, Jul 30, Aug 28, Sep 16.
  1. Hot weather caused people to buy more ice cream.
  2. Sales were highest in July.Richtige Antwort
  3. July will always have the highest sales.
  4. Every month sold more than the month before.

Erklärung

July has the greatest displayed value, 3,000 euros, so the chart supports a peak within this six-month period. It does not measure temperature or repeat across years, so it cannot establish heat as a cause or guarantee the same peak every year.

Mit diesem Test weitermachen

Übung starten
Frage 25: According to the chart, which conclusion is supported by… · Reading Charts and Tables · Questena