QuestenaÜben und erkennen, was als Nächstes dran ist
Frage 6

According to the chart, in which season did City B receive more rainfall than City A?
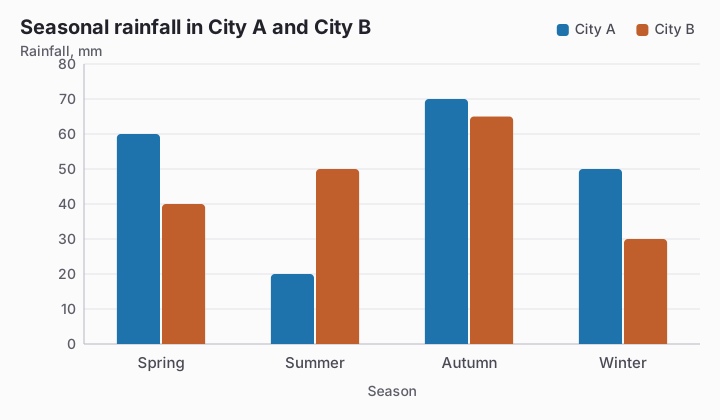
Bar chart titled Seasonal rainfall in City A and City B. Value axis: Rainfall, mm, gridlines every 10 from 0 to 80. Data: City A: Spring 60, Summer 20, Autumn 70, Winter 50. City B: Spring 40, Summer 50, Autumn 65, Winter 30.
  1. Spring
  2. Winter
  3. SummerRichtige Antwort
  4. Autumn

Erklärung

In Summer, City B records 50 mm while City A records 20 mm, making it the only season where B is higher. Autumn is close, but B's 65 mm remains below A's 70 mm there.

Mit diesem Test weitermachen

Übung starten
Frage 6: According to the chart, in which season did City B receive… · Reading Charts and Tables · Questena