According to the chart, at which measured time was the air temperature highest?
Erklärung
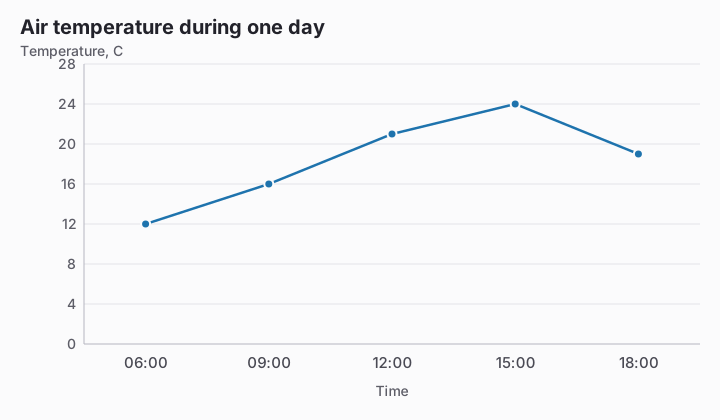
The plotted temperature reaches its maximum of 24 C at 15:00. At 12:00 it is 21 C, so that earlier high point is still 3 C below the day's measured peak.
The plotted temperature reaches its maximum of 24 C at 15:00. At 12:00 it is 21 C, so that earlier high point is still 3 C below the day's measured peak.