QuestenaPráctica que te muestra qué repasar después
Pregunta 7

According to the chart, which statements about the team's scores are supported? Select all that apply.
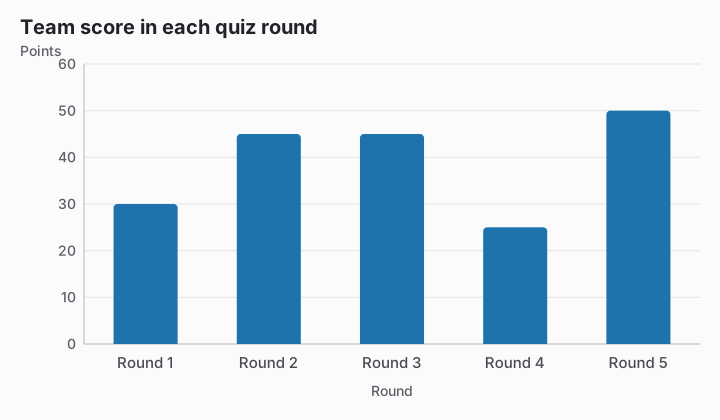
Bar chart titled Team score in each quiz round. Value axis: Points, gridlines every 10 from 0 to 60. Data: Round 1 30, Round 2 45, Round 3 45, Round 4 25, Round 5 50.
  1. Round 5 has the highest score.Respuesta correcta
  2. Rounds 2 and 3 have equal scores.Respuesta correcta
  3. The score rises in every successive round.
  4. Round 1 has the lowest score.

Explicación

Round 5 has the greatest value at 50 points, and Rounds 2 and 3 match at 45, so those statements are supported. The sequence drops in Round 4, and that round's 25 points are lower than Round 1's 30, which disproves both remaining claims.

Continúa con este test

Empezar la práctica
Pregunta 7: According to the chart, which statements about the team's… · Reading Charts and Tables · Questena