Questenaتمرینی که نشان می‌دهد بعد چه چیزی را مرور کنید
سؤال 11

According to the chart, which description best summarizes the fuel price trend from January through June?
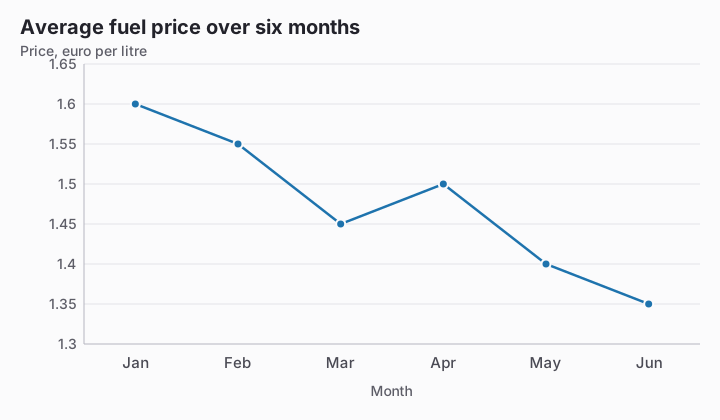
Line chart titled Average fuel price over six months. Value axis: Price, euro per litre, gridlines every 0.05 from 1.3 to 1.65. The value axis starts at 1.3, not at zero. Data: Jan 1.6, Feb 1.55, Mar 1.45, Apr 1.5, May 1.4, Jun 1.35.
  1. It fell overall, with a brief rise in April.پاسخ درست
  2. It rose steadily throughout the period.
  3. It stayed unchanged after March.
  4. It fell every month without interruption.

توضیح

The price declines from 1.60 in January to 1.35 in June, although it rises from 1.45 to 1.50 in April. Describing an uninterrupted fall misses that temporary increase, while describing overall growth reverses the endpoints.

ادامهٔ این آزمون

شروع تمرین
سؤال 11: According to the chart, which description best summarizes… · Reading Charts and Tables · Questena