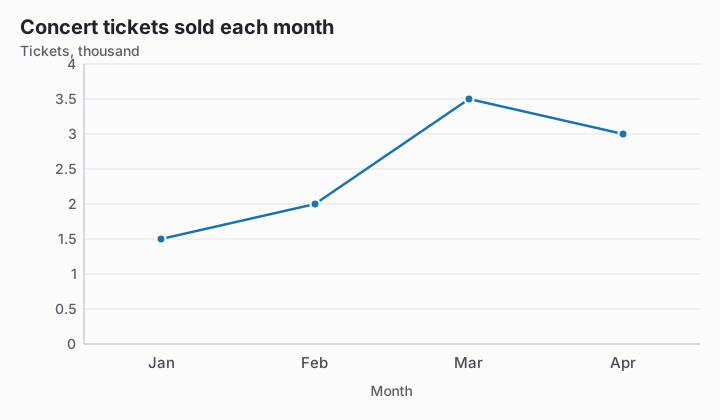
According to the chart, how many tickets were sold in March?
Explication
March is plotted at 3.5 on an axis measured in thousands, so multiplying by 1,000 gives 3,500 tickets. Reading the label as 3.5 individual tickets ignores the scale unit, while 350 applies the wrong conversion factor.