QuestenaUn entraînement qui indique quoi revoir ensuite
Question 26

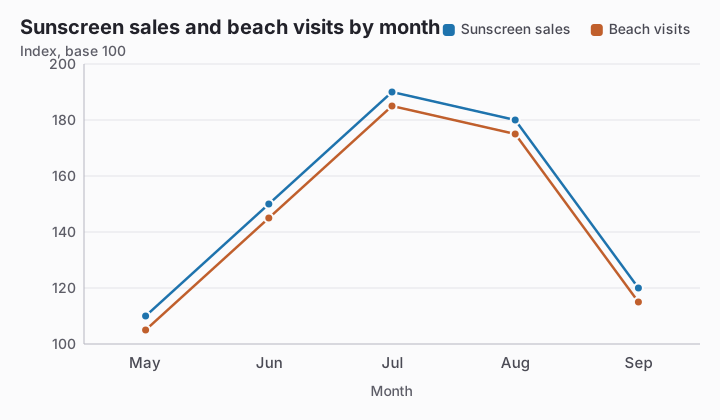
According to the chart, which conclusion is justified about sunscreen sales and beach visits?

Line chart titled Sunscreen sales and beach visits by month. Value axis: Index, base 100, gridlines every 20 from 100 to 200. The value axis starts at 100, not at zero. Data: Sunscreen sales: May 110, Jun 150, Jul 190, Aug 180, Sep 120. Beach visits: May 105, Jun 145, Jul 185, Aug 175, Sep 115.
  1. Beach visits caused sunscreen sales to rise.
  2. Sunscreen sales caused more beach visits.
  3. The indexes prove both totals were equal.
  4. The two indexes moved in similar patterns.Bonne réponse

Explication

Both indexes rise through July and then fall through September, so their month-to-month patterns are similar. The chart records association only; it provides no evidence that either series causes changes in the other.
Continuer avec ce test

Commencer l’entraînement
Question 26: According to the chart, which conclusion is justified about… · Reading Charts and Tables · Questena