QuestenaՎարժանք, որը ցույց է տալիս՝ ինչ կրկնել հաջորդիվ
Հարց 22

According to the chart, how many units did the factory produce in Q2?
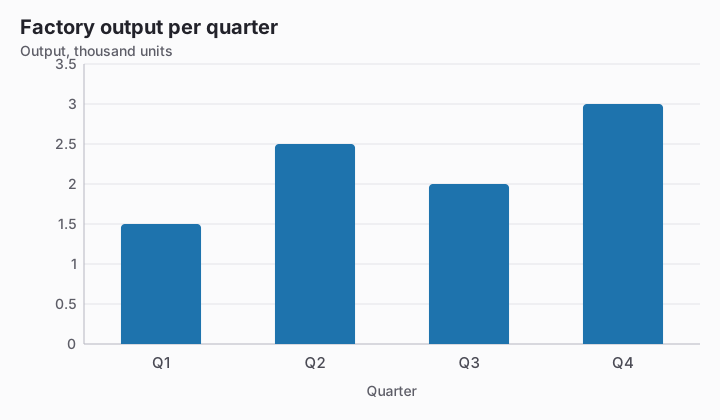
Bar chart titled Factory output per quarter. Value axis: Output, thousand units, gridlines every 0.5 from 0 to 3.5. Data: Q1 1.5, Q2 2.5, Q3 2, Q4 3.
  1. 250 units
  2. 2,500 unitsՃիշտ պատասխան
  3. 25 units
  4. 2.5 units

Բացատրություն

Q2 is shown at 2.5 on an axis measured in thousand units, so the production count is 2.5 times 1,000, or 2,500 units. A reading of 250 uses a factor of 100 and therefore understates the scale by ten.

Շարունակեք այս թեստով

Սկսել վարժանքը
Հարց 22: According to the chart, how many units did the factory… · Reading Charts and Tables · Questena