QuestenaПрактика, после которой понятно, что повторить
Вопрос 14

According to the chart, how many tickets were sold in March?
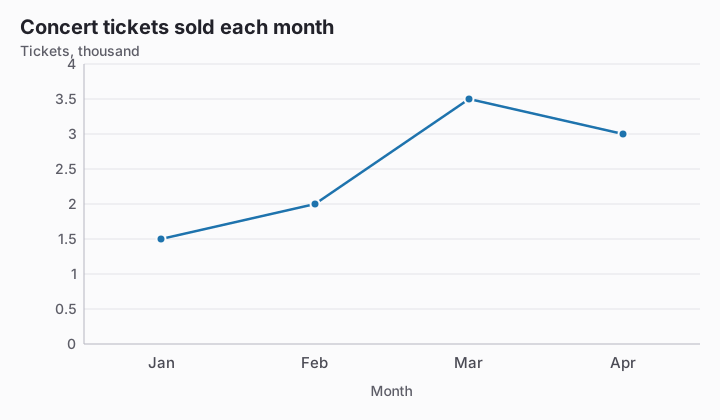
Line chart titled Concert tickets sold each month. Value axis: Tickets, thousand, gridlines every 0.5 from 0 to 4. Data: Jan 1.5, Feb 2, Mar 3.5, Apr 3.
  1. 3.5 tickets
  2. 350 tickets
  3. 3,500 ticketsПравильный ответ
  4. 35 tickets

Объяснение

March is plotted at 3.5 on an axis measured in thousands, so multiplying by 1,000 gives 3,500 tickets. Reading the label as 3.5 individual tickets ignores the scale unit, while 350 applies the wrong conversion factor.

Продолжить работу с тестом

Начать тренировку
Вопрос 14: According to the chart, how many tickets were sold in March? · Reading Charts and Tables · Questena