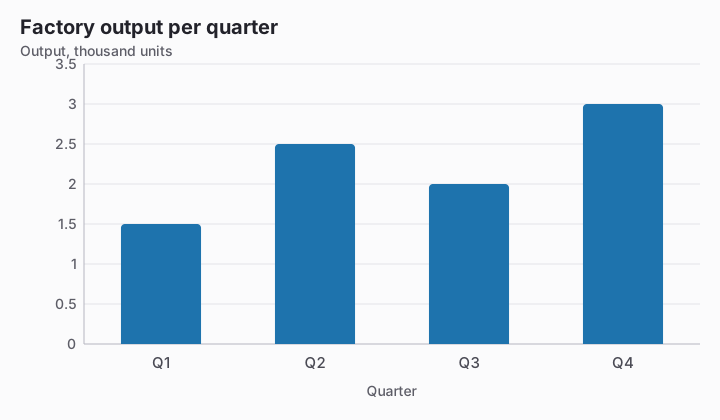
According to the chart, how many units did the factory produce in Q2?
توضیح
Q2 is shown at 2.5 on an axis measured in thousand units, so the production count is 2.5 times 1,000, or 2,500 units. A reading of 250 uses a factor of 100 and therefore understates the scale by ten.