Questenaتمرینی که نشان می‌دهد بعد چه چیزی را مرور کنید
سؤال 23

According to the chart, which value is closest to the number of parcels handled on Tuesday?
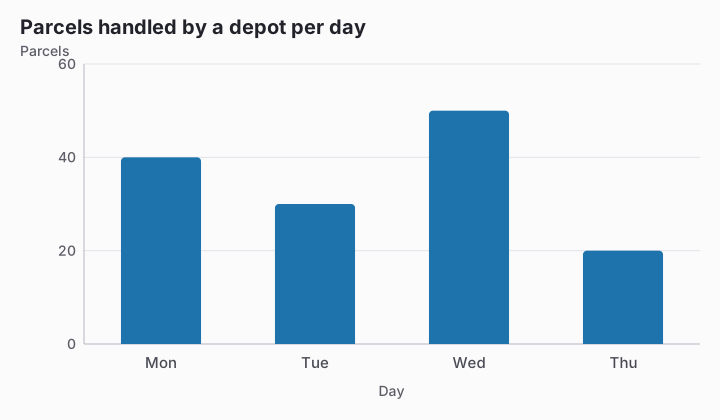
Bar chart titled Parcels handled by a depot per day. Value axis: Parcels, gridlines every 20 from 0 to 60. Data: Mon 40, Tue 30, Wed 50, Thu 20.
  1. 20 parcels
  2. 40 parcels
  3. 30 parcelsپاسخ درست
  4. 50 parcels

توضیح

Tuesday's bar ends halfway between the 20 and 40 gridlines, so it represents about 30 parcels. Choosing 20 or 40 would snap the endpoint to a neighboring labelled line instead of interpolating the midpoint.

ادامهٔ این آزمون

شروع تمرین
سؤال 23: According to the chart, which value is closest to the… · Reading Charts and Tables · Questena