QuestenaPractice that shows what to review next
Question 13

According to the chart, in which quarter did App X first record more downloads than App Y?
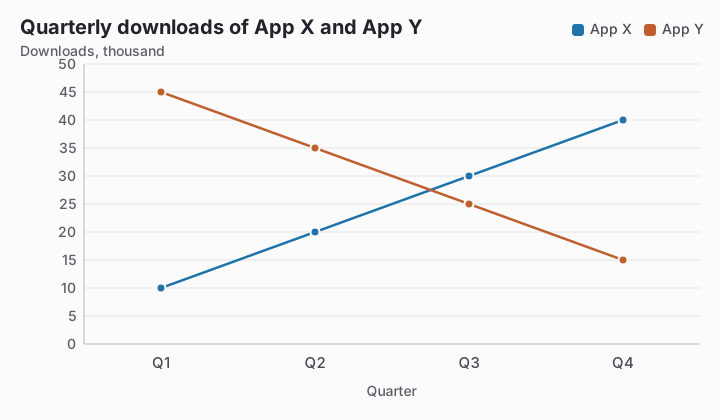
Line chart titled Quarterly downloads of App X and App Y. Value axis: Downloads, thousand, gridlines every 5 from 0 to 50. Data: App X: Q1 10, Q2 20, Q3 30, Q4 40. App Y: Q1 45, Q2 35, Q3 25, Q4 15.
  1. Q2
  2. Q4
  3. Q1
  4. Q3Correct answer

Explanation

In Q3, App X reaches 30 thousand downloads while App Y is at 25 thousand, so X is higher there for the earliest time. Q2 is too soon because X has only 20 thousand compared with Y's 35 thousand.

Continue with this test

Start practice
Question 13: According to the chart, in which quarter did App X first… · Reading Charts and Tables · Questena