QuestenaPractice that shows what to review next
Question 3

According to the chart, how many visitors came to the museum on Thursday? Enter the number of visitors.
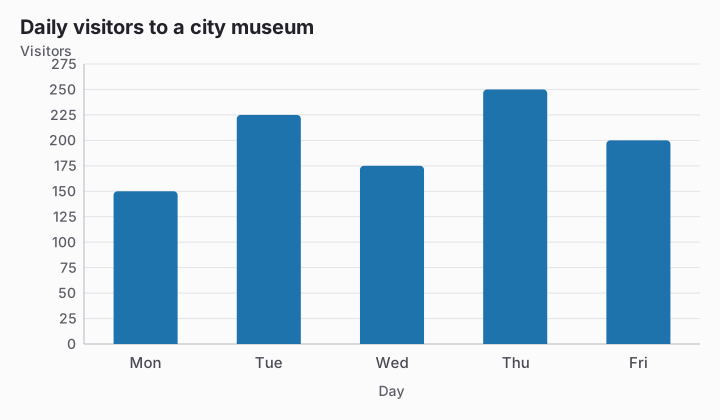
Bar chart titled Daily visitors to a city museum. Value axis: Visitors, gridlines every 25 from 0 to 275. Data: Mon 150, Tue 225, Wed 175, Thu 250, Fri 200.

Correct answer

250 · Accepted units: visitors

Explanation

The Thursday bar aligns with the 250 gridline, so the exact reading is 250 visitors. The nearby value 225 belongs to Tuesday and would result from following the wrong category.

Continue with this test

Start practice
Question 3: According to the chart, how many visitors came to the… · Reading Charts and Tables · Questena