These questions hand you a bar chart and ask you to read one bar, compare two of them, or decide which statements the chart supports. Nothing is hidden: the answer is already drawn, and the whole task is turning the wording of the question into the right reading.
Reading a bar chart in three moves
First, read the two axes before looking at any bar. One axis names the categories; the other carries the quantity, its unit where one is given, and a gridline step. Second, read a bar as a value, not as a height: follow its end across to the value axis and see which labelled line it meets, or where it falls between two lines. Third, do what the question's verb asks. A common wrong answer is a correct reading put through the wrong operation.
| What the question asks | What you do on the chart |
|---|---|
| The most, the largest, the least | Read the value of every bar in the chart, then pick the extreme one |
| How many more, how much fewer | Read both named bars and subtract the smaller value from the larger |
| How many altogether | Read each named bar and add |
| Half as much, twice as much, three times | Divide or multiply the reference bar's value, then find the bar that matches that number |
| Which statements are supported | Test each statement on its own against the read values, and keep every one that holds |
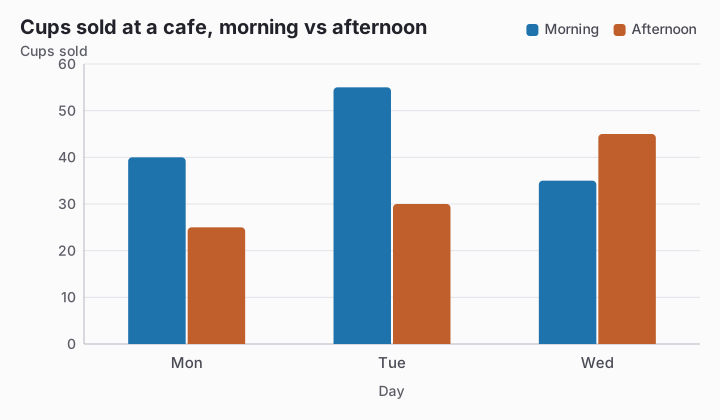
Two variations change nothing about the method. Bars drawn sideways are read along the horizontal value axis in exactly the same way. And when a chart shows two groups of bars, the legend says which group each bar belongs to: a comparison between the groups is made inside one category, between the two bars that stand there together.
Where the marks are lost
- Adding the two bars when the question asks how many more. The sum is a real number you can compute from the chart, so it looks like a considered answer, but the difference is what was asked; subtract.
- Answering a comparison with a value that is simply visible somewhere on the chart. Options are built from other categories' readings, and a number that you can point at is not the number the question defines.
- Turning a ratio question into a difference. Half as much, twice as much and three times as much are multiplications, not one step up or down the ranking, so the category that sits next to the reference bar is usually a decoy.
- Deciding a two-group comparison by which pair looks close. In a category where the bars nearly match, the order can still be the same as everywhere else; read both values before you accept a category as the exception.
- Accepting a sweeping claim because the overall shape agrees with it. A statement that a series rises in every successive step is disproved by one step that goes the other way, however small it is.
- Naming the first or last category as the extreme because of where it stands, without reading every bar. The position on the category axis is only the order of listing, so a claim that some category holds the largest or the smallest value is settled by reading all of them.
Try it
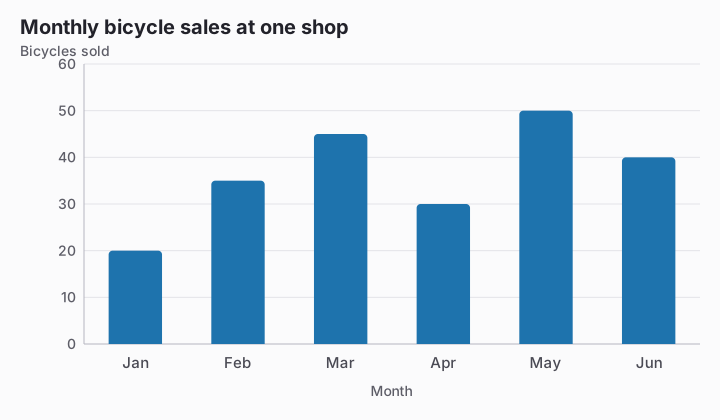
According to the chart, in which month did the shop sell the most bicycles?
- March
- June
- May
- February
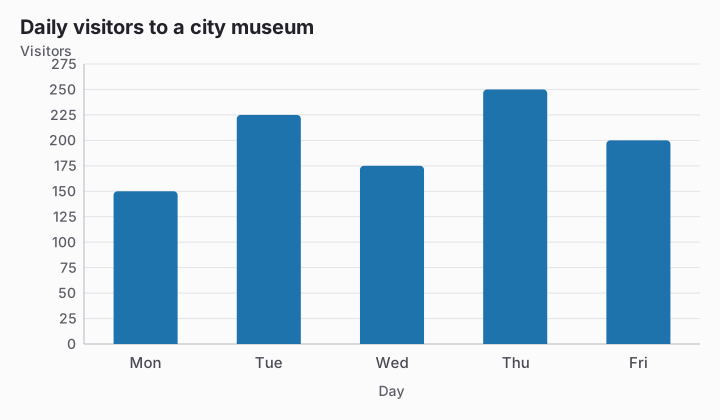
According to the chart, how many visitors came to the museum on Thursday? Enter the number of visitors.
According to the chart, how many more cups were sold on Tuesday morning than on Tuesday afternoon? Enter the number of cups.