QuestenaPractice that shows what to review next
Question 24

According to the chart, what happened to the company's sales level in each of the three years?
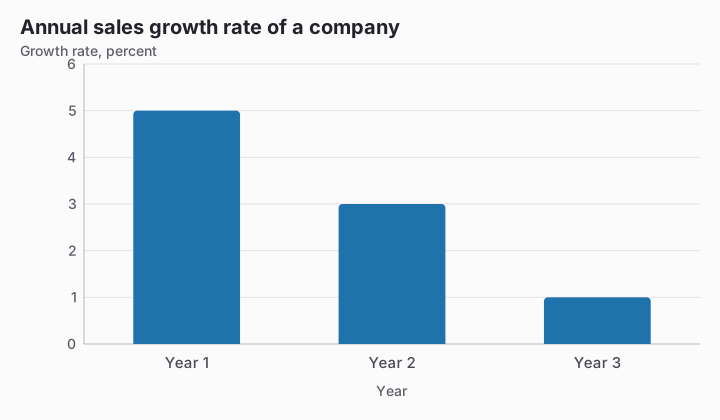
Bar chart titled Annual sales growth rate of a company. Value axis: Growth rate, percent, gridlines every 1 from 0 to 6. Data: Year 1 5, Year 2 3, Year 3 1.
  1. Sales fell
  2. Sales stayed flat
  3. Sales returned to zero
  4. Sales roseCorrect answer

Explanation

Every growth rate is positive, so sales increased in each year even though the increases became smaller. Saying sales fell confuses a declining rate of growth with a decline in the underlying sales level.

Continue with this test

Start practice
Question 24: According to the chart, what happened to the company's… · Reading Charts and Tables · Questena